USING SUPER BOWL ADS IN THE CLASSROOM
©2006 Frank Baker, Media Educator
 |
 |
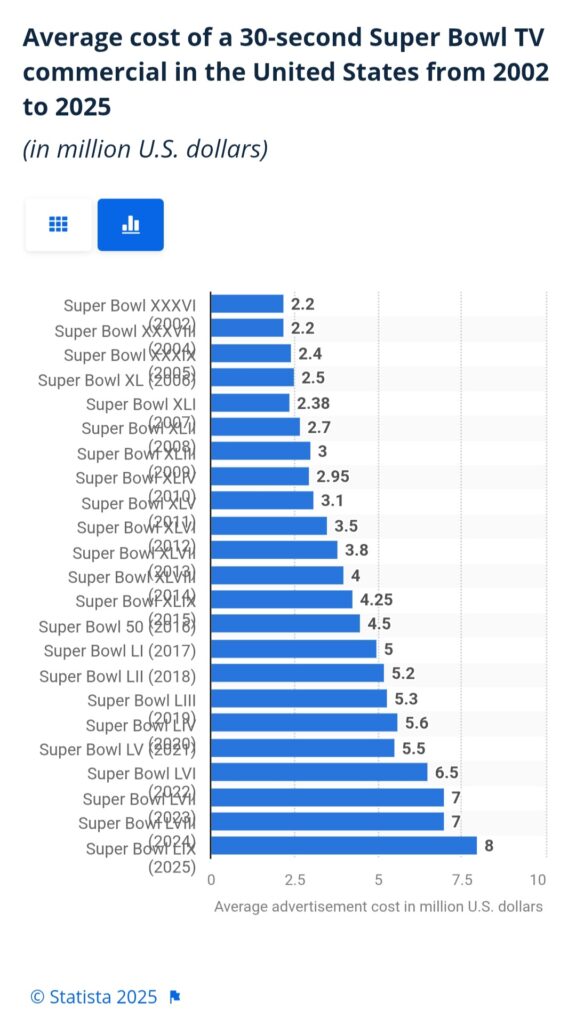

Source: https://www.statista.com/chart/12697/super-bowl-facts/
 Source
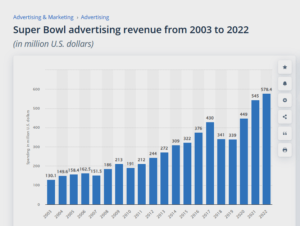
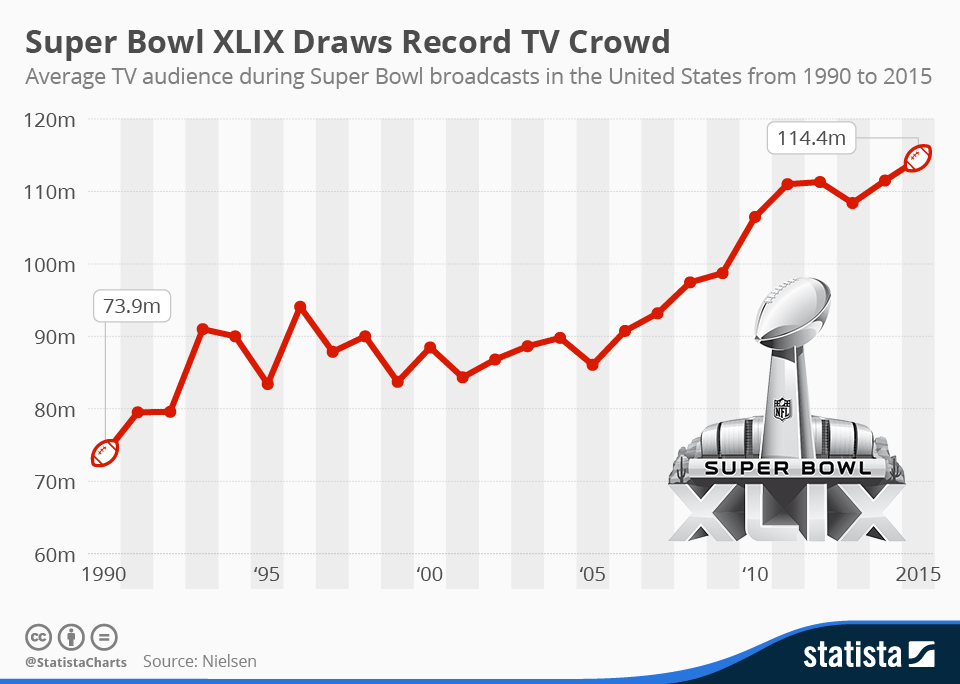
Source Super Bowl Ad Insanity Explained In Six Charts
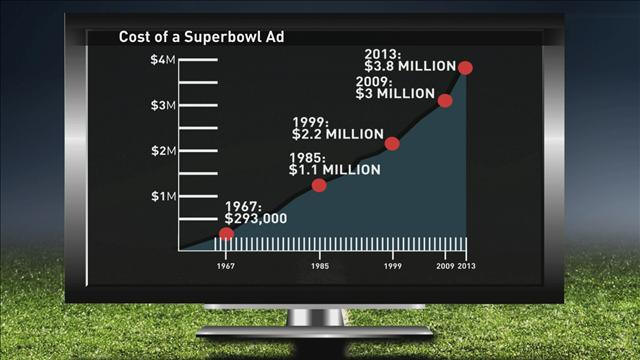
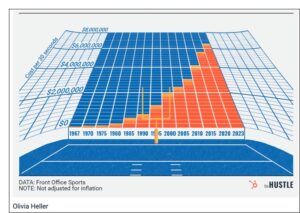
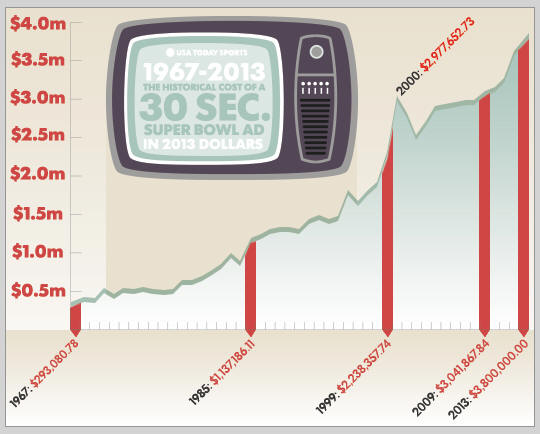
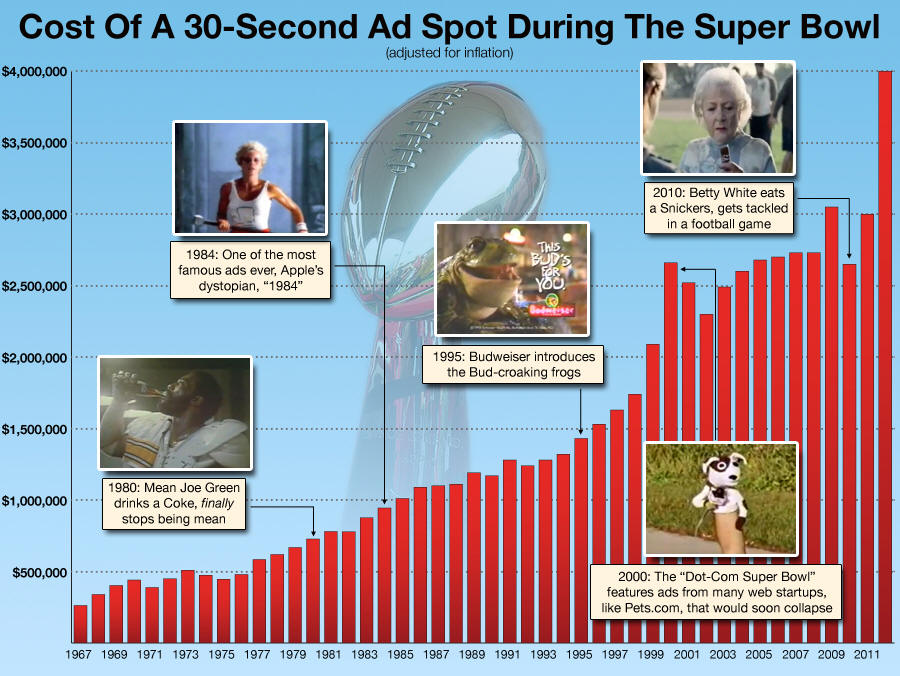
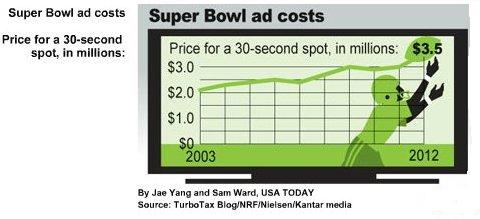
The rising costs of Super Bowl ads in one chart
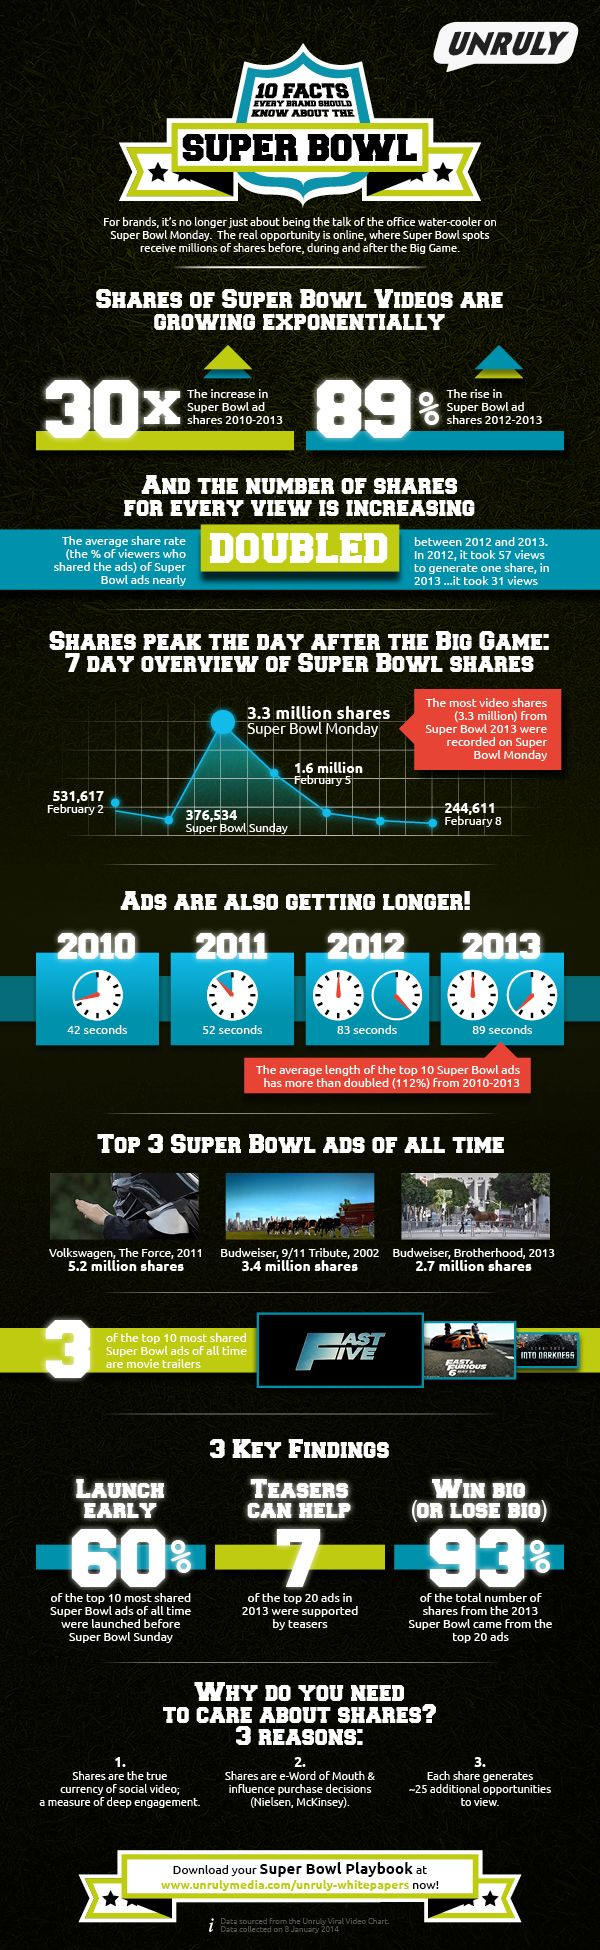
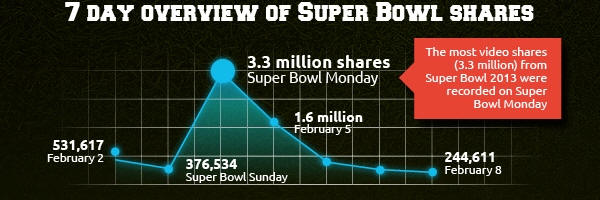
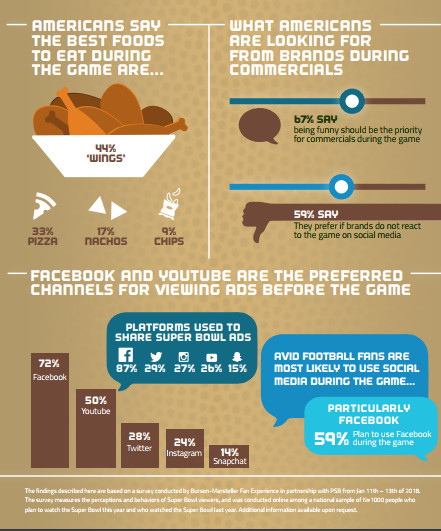
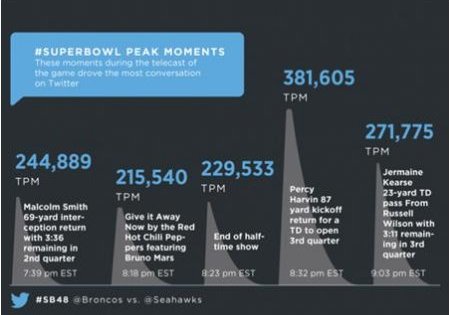
Top 10 Super Bowl Social Video Facts Every Brand Should Know
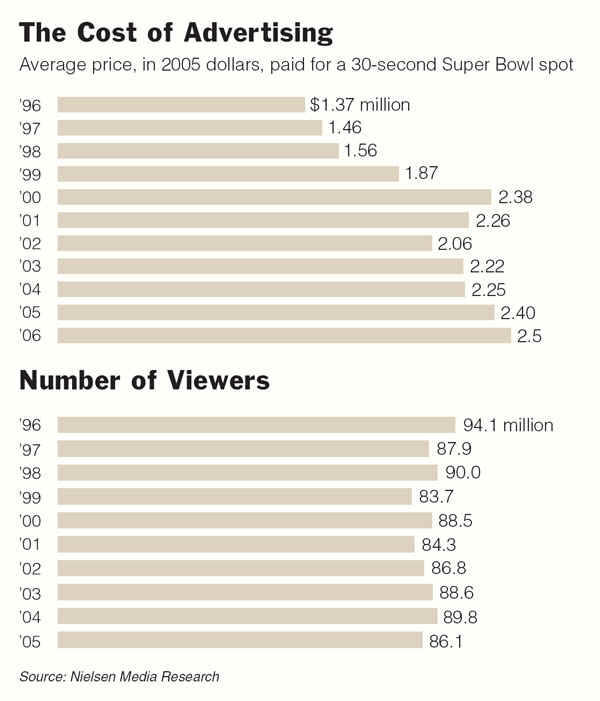
Source: USA Today
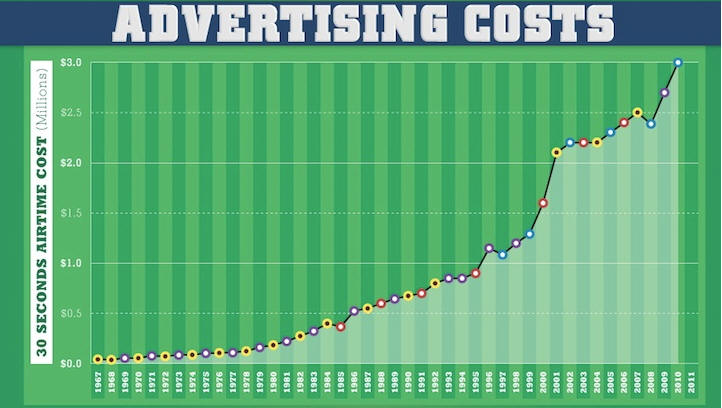
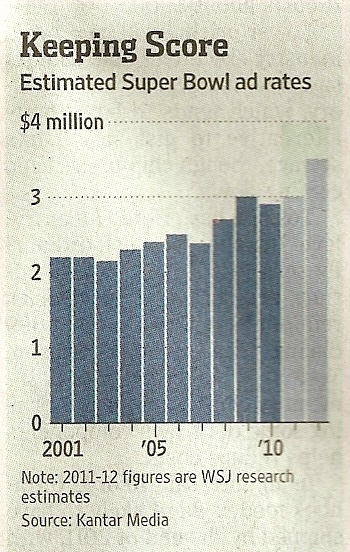
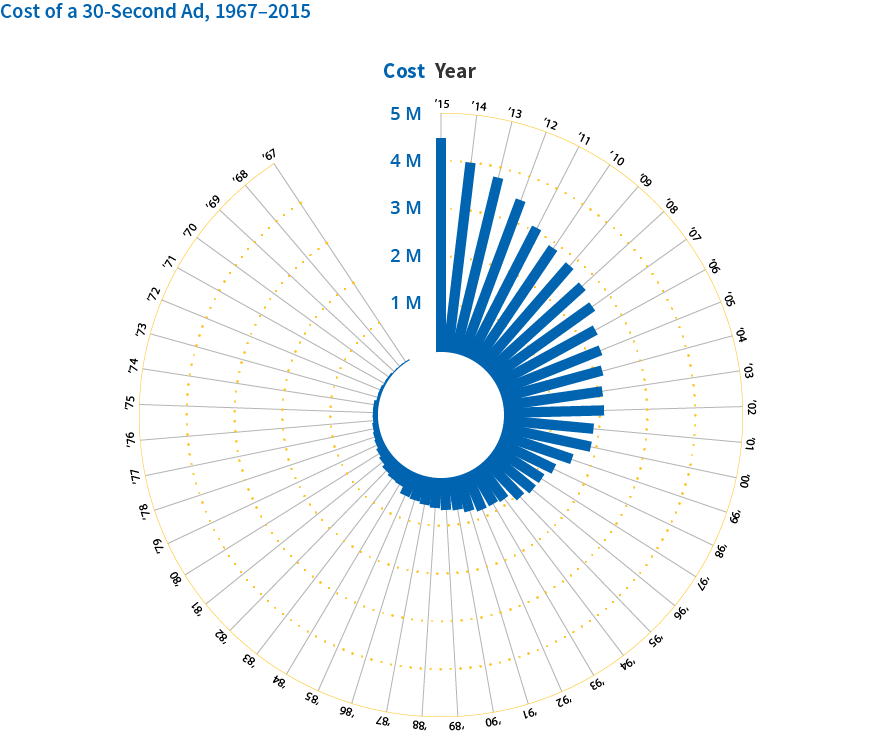
 NOTE: Additional year’s data has been added to this chart by Frank Baker |
||||||
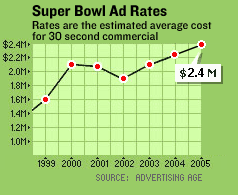
| Year | Price *1 | Price Adjusted for Inflation *2 | Network | Rating *3 | Avg. Number Home | Avg. Number Viewers |
|---|---|---|---|---|---|---|
| 1967 | $40,000 | $245,350 | CBS,NBC *4 | 41.1 | 22,570,000 | 51,180,000 |
| 1968 | 54,000 | 319,098 | CBS | 36.8 | 20,610,000 | 39,120,000 |
| 1969 | 67,500 | 381,555 | NBC | 36.0 | 20,520,000 | 41,660,000 |
| 1970 | 78,200 | 416,379 | CBS | 39.4 | 23,050,000 | 44,270,000 |
| 1971 | 72,000 | 364,607 | NBC | 39.9 | 23,980,000 | 46,040,000 |
| 1972 | 86,000 | 421,233 | CBS | 44.2 | 27,450,000 | 56,640,000 |
| 1973 | 103,500 | 488,568 | NBCk | 42.7 | 27,670,000 | 53,320,000 |
| 1974 | 107,000 | 460,397 | CBS | 41.6 | 27,540,000 | 51,700,000 |
| 1975 | 110,000 | 424,436 | NBC | 42.4 | 29,040,000 | 56,050,000 |
| 1976 | 125,000 | 452,873 | CBS | 42.3 | 29,440,000 | 57,710,000 |
| 1977 | 162,000 | 555,980 | NBC | 44.4 | 31,610,000 | 62,050,000 |
| 1978 | 185,000 | 595,423 | CBS | 47.2 | 34,410,000 | 78,940,000 |
| 1979 | 222,000 | 652,105 | NBC | 47.1 | 35,090,000 | 74,740,000 |
| 1980 | 275,000 | 708,296 | CBS | 46.3 | 35,330,000 | 76,240,000 |
| 1981 | 324,300 | 748,356 | NBC | 44.4 | 34,540,000 | 68,290,000 |
| 1982 | 345,000 | 737,120 | CBS | 49.1 | 40,020,000 | 85,240,000 |
| 1983 | 1400,000 | 824,936 | NBC | 48.6 | 40,480,000 | 81,770,000 |
| 1984 | 450,000 | 888,987 | CBS | 46.4 | 38,880,000 | 77,620,000 |
| 1985 | 500,000 | 954,137 | ABC | 46.4 | 39,390,000 | 85,530,000 |
| 1986 | 550,000 | 1,014,070 | NBC | 48.3 | 41,490,000 | 92,570,000 |
| 1987 | 575,000 | 1,041,607 | CBS | 45.8 | 40,030,000 | 87,190,000 |
| 1988 | 600,000 | 1,045,145 | ABC | 41.9 | 37,120,000 | 80,140,000 |
| 1989 | 675,000 | 1,122,497 | NBC | 43.5 | 39,320,000 | 81,590,000 |
| 1990 | 700,000 | 1,106,186 | CBS | 39.0 | 35,920,000 | 73,852,000 |
| 1991 | 800,000 | 1,198,515 | ABC | 41.9 | 39,010,000 | 79,510,000 |
| 1992 | 800,000 | 1,166,896 | CBS | 40.3 | 37,120,000 | 79,590,000 |
| 1993 | 850,000 | 1,200,770 | NBC | 45.1 | 41,990,000 | 90,990,000 |
| 1994 | 900,000 | 1,240,150 | NBC | 45.5 | 42,860,000 | 90,000,000 |
| 1995 | 1,000,000 | 1,339,973 | ABC | 41.3 | 39,400,000 | 83,420,000 |
| 1996 | 1,100,000 | 1,435,370 | NBC | 46.0 | 44,145,000 | 94,080,000 |
| 1997 | 1,200,000 | 1,519,674 | FOX | 43.3 | 42,000,000 | 87,870,000 |
| 1998 | 1,300,000 | 1,621,886 | NBC | 44.5 | 43,630,000 | 90,000,000 |
| 1999 | 1,600,000 | 1,963,990 | FOX | 40.2 | 39,992,000 | 83,720,000 |
| 2000 | 2,100,000 | 2,503,131 | ABC | 43.3 | 43,618,000 | 88,465,000 |
| 2001 | 2,050,000 | 2,357,880 | CBS | 40.4 | 41,270,000 | 84,335,000 |
| 2002 | 1,900,000 | 2,160,721 | FOX | 40.4 | 42,664,000 | 86,801,000 |
| 2003 | 2,100,000 | 2,323,355 | ABC | 40.7 | 43,433,000 | 88,637,000 |
| 2004 | 2,250,000 | 2,445,073 | CBS | 41.4 | 44,908,000 | 89.795,000 |
| 2005 | 2,400,000 | 2,532,392 | FOX | 41.1 | 45,081,000 | 86,072,000 |
| 2006 | 2,500,000 | 2,541,562 | ABC | 41.6 | 45,867,000 | 90,745,000 |
| 2007 | 2,600,000 | 2,600,000 | CBS | 42.1 | 47,505,000 | 93,200,000 |
| 2008 | 2,700,000 | 2,700,000 | FOX | 44.7 | 48,665,000 | 97,500,000 |
| 2009 | estimated 3,000,000 |
NBC | 42.1 | 48,139,000 | 98,732,000 | |
| 2010 | $2.5~$2.9M | CBS | 46.4 | 106,500,000 | ||
| 2011 | approx $3M | FOX | 46.0 | ***111,000,000 | ||
| 2012 | $3.5M | NBC | 47.0 | **111,340,000 | ||
| 2013 | ~$4.0M | CBS | 46.3 | 108,700,000 | ||
| 2014 | $4.0M | FOX | 46.7 | *112,200,000 | ||
| 1. Consensus reported price for :30 commercial. 2. Adjusted for inflation in 2007 dollars. 3. Percentage of TV households watching average minute of Super Bowl telecast. 4. First Super Bowl aired on both CBS and NBC; CBS charged $85,000 and NBC charged $75,000 for one minute. Source: “Advertising Age” (prices), Nielsen Media Research (ratings) ** Second most viewed TV program in television history ***Third most watched TV program in television history * Most watched TV program in TV History |
||||||
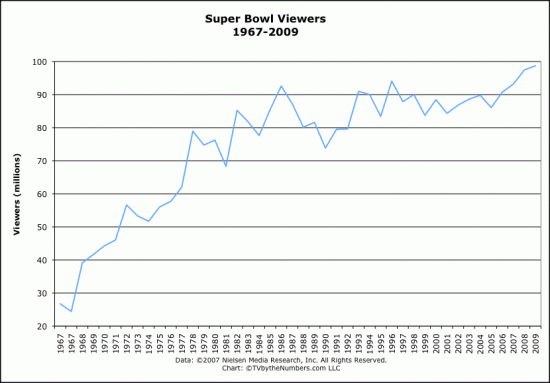
Source: TV By The Numbers

from http://adage.com/SuperBowlBuyers/superbowlhistory07.html
Share This Page: