Math in the Media: What is Rating / Share?
 Math In The Media
What is a RATING? What is a SHARE? It will be essential for students to understand these terms before they will understand the Nielsen ratings weekly report. You may wish to download, or have your students read these two articles: RATINGS SHARE
The following is taken from the NielsenMedia.com website:
|
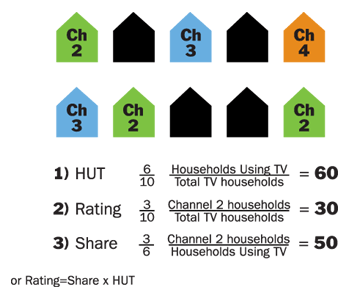
Ratings 101 Rating (RTG or AA%): The estimate of the size of a television audience relative to the total universe, expressed as a percentage. The estimated percent of all TV households or persons tuned to a specific station. In the example below, three of the 10 homes in the universe are tuned to channel 2. That translates to a 30 rating.
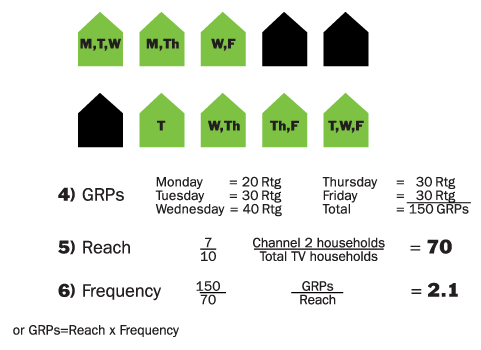
Share (SHR): The percent of the Households Using Television (HUT) or Persons Using Television (PUT) which are tuned to a specific program or station at a specified time. Using the example above, channel 2 is being viewed in three of the six homes using television. That means it has a 50 share of audience. Gross Rating Points (GRPs) or Target Rating Points (TRPs) The sum of all rating points achieved for a particular period of time and/or schedule of commercials or spots (called Gross Impressions when expressed as the sum of all exposures to a given time period or spot schedule). The chart at the bottom of the following page illustrates reach and frequency. Each home shows which days the set was in use during the time a commercial or spot aired. Since each home comprises 10% of the universe of 10 homes, each represents a 10 rating every time the spot airs. By adding these ratings we arrive at the total of 150 Gross Rating Points. Reach (Cume) The number of different or unduplicated households or persons that are exposed to a television program or commercial at least once during the average week for a reported time period. During the course of the schedule illustrated on the next page, seven different households were exposed to the commercial at least once. Since each home represents 10 % of the universe, this makes the reach or cume 70%. Frequency Average number of times a household or a person viewed a given television program, station or commercial during a specific time period. In our example, the Gross Rating Points achieved (150) is divided by the percent of homes reach (70) to determine the frequency of 2.1.
Frequency Distribution Number or percentage of households or persons that are exposed to a given program, station, or commercial one time, two times, three times, etc. |
——————————————————————————————-
Here is a simple way to explain these two concepts:
(NOTE: both RATING and SHARE are PERCENTAGES.)
RATING = households tuned in to a given program
all households with television
(more simply: rating points measure the number of households watching programs at a given time)
SHARE = households tuned in to a given program
all households tuned in to TV at that time (HUT)
(more simply: share points measure the percentage of all sets in use at a given time watching a particular program)
Here’s an example: Your talk show is aired in a market that has 1 million television households; 400,000 are tuned in to you. Therefore:
400,000
1,000,000 = .40, or a rating of 40
At the time your show airs, however, there are only 800,000 households using television. Therefore, your share of the available audience is
Share = 400,000
800,000 = .50, or a rating of 50
If you can explain why a specific program’s share is always higher than its rating, then you understand the difference between the two. (source: Introduction To Mass Communication, by Stanley J. Baran, McGraw Hill, 2001 pg. 280)